The Geometry of Trace Data
Raw telemetry is a map without a legend. We provide the coordinate system required to interpret complex distributed traces, transforming erratic system signals into actionable scaling intelligence.
Filtering Through Noise
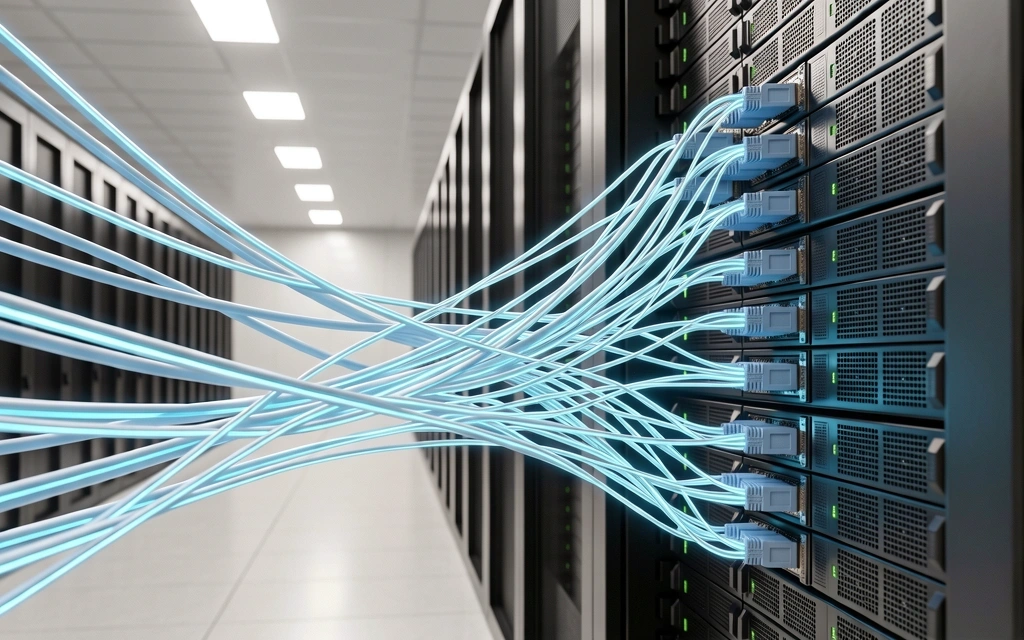
High-performance infrastructure produces millions of spans per second. Effective trace analysis starts not with collection, but with aggressive, intelligent filtering. We focus on identifying high-cardinality bottlenecks and rare outliers that actually impact your scaling trajectory.
- Identifying latent circular dependencies in microservices.
- Quantifying the performance tax of serialization layers.
- Isolating noise from meaningful variance in trace data.
Analytical Waypoints
Our interpretation methodology follows a structured progression to ensure that infrastructure scaling remains predictable and efficient.
Ingestion & Norm
Before analysis begins, we normalize disjointed trace data from disparate platforms—OpenTelemetry, Jaeger, or proprietary formats—into a unified context.
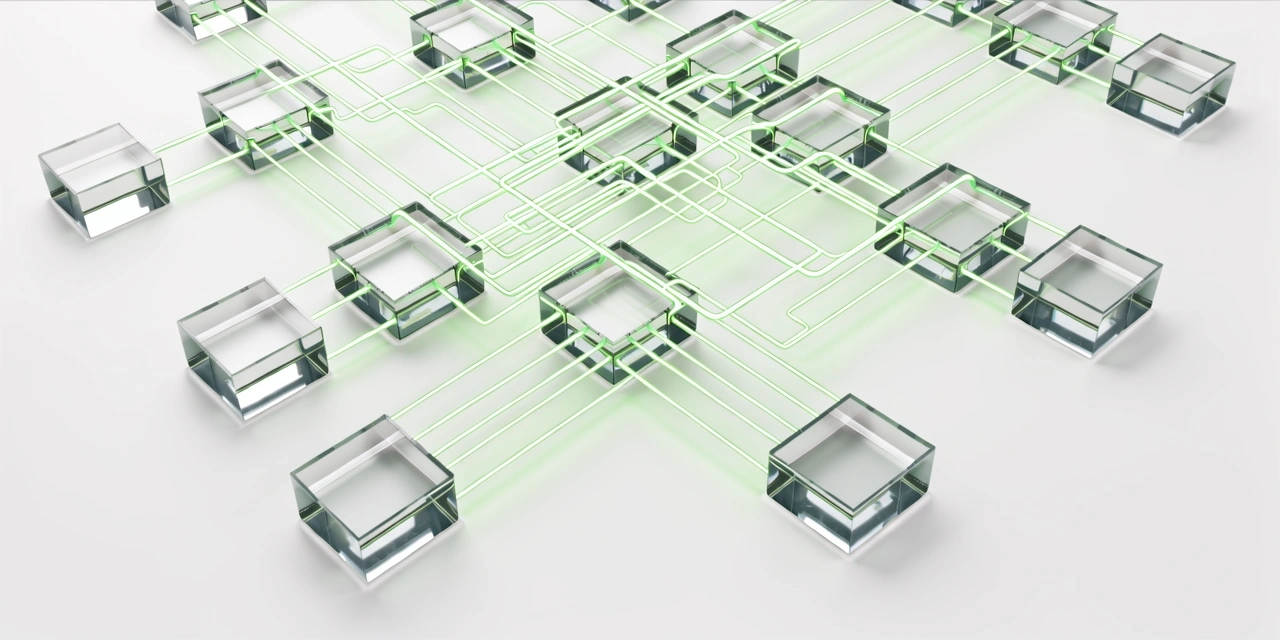
Topology Mapping
We reconstruct the mental map of your system architecture by observing how requests flow across nodes, uncovering "shadow" dependencies.
Scaling Forecast
By applying historical trace patterns to projected load, we identify exactly where the architecture will buckle before it happens.
The Trace Dossier
We don't just provide dashboards. We deliver a comprehensive technical interpretation of system behavior under stress.
Analysis Status
Ready for Audit
Distributed Context Propagation
Interpretation hinges on the integrity of the trace context. We audit your propagation headers to ensure that spans aren't orphaned as they move across load balancers, proxies, and message queues. Without a clean lineage, scaling analysis is speculative.
Latency Attribution Analysis
Is the delay in the network, the database, or the runtime environment? We use subtractive analysis to isolate the exact origin of latency. By comparing parent and child span entry/exit points, we pinpoint overhead with microsecond precision.
Resource Correlation
Trace data is most powerful when layered over infrastructure metrics. We synchronize trace timestamps with CPU, memory, and disk I/O spikes to confirm if software bottlenecks are being masked by hardware over-provisioning.
Interpreting the Findings
Common technical questions regarding our analysis depth.
Scale With Precision
Understanding your system is the first step toward scaling it. Contact our Bangkok-based experts for a deep-dive analysis of your current trace infrastructure.
Office Location
Bangkok 32, Thailand
Technical Support
+66 2 7300 0932
Direct Inquiry
info@cleartracescale.digital